Economists Use “Fuzzy Graphs” to Challenge Data on the Human Cost of Trump Sanctions on Venezuela
In our paper, “Sanctions as Collective Punishment: The Case of Venezuela,” we looked at some of the ways in which the sanctions on Venezuela imposed by the US government curtail access to essential and life-saving imports, and some of the data on impacts such as mortality. We concluded that US economic sanctions since August 2017 have likely caused a dire rise in mortality and a grave aggravation of Venezuela’s economic crisis. We concluded that the sanctions imposed since January will be much more devastating in terms of increased hunger and mortality, and of economic losses, than have the prior US executive orders and other economic sanctions.
The fact that these sanctions cause extreme suffering and deaths should not be a matter of dispute. If you cut off access to medicines, medical equipment, imports needed to maintain water and sanitation infrastructure, and for spare parts, and you prevent an economy that is in a deep depression from recovering, a lot of people are going to suffer diseases and premature mortality.
Economists Miguel Angel Santos and Ricardo Hausmann have challenged our claim that the sanctions dramatically worsened Venezuela’s crisis of oil production and exports, and therefore of the ability to finance food and medical imports.
In what follows, we look at their arguments, which are based on easily identified errors.
* * *
Santos begins with a graph from our paper that shows both Venezuelan and Colombian oil production on the left and right-hand axes, respectively, in thousands of barrels per day, from 2013 to 2018. Both are fairly constant on average (with Colombian production much more volatile) until January of 2016; they then decline at about the same rate until August of 2017, when President Trump issued an executive order imposing broad financial sanctions on Venezuela. Venezuelan oil production then falls at three times the rate that it had been falling since January 2016.

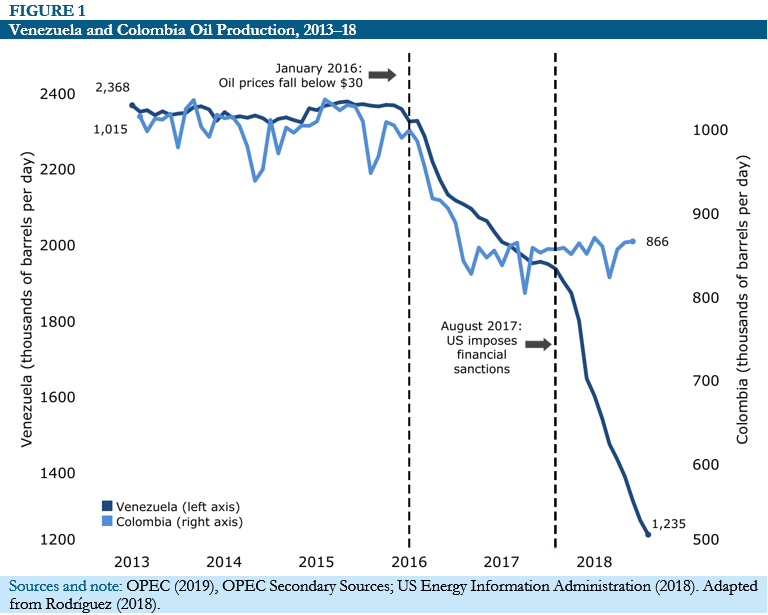
Figure 1 from Weisbrot and Sachs
Figure 1 from Weisbrot and Sachs
Santos responds with a graph that shows the two countries’ production (only since 2016) on just one axis and an accusation.
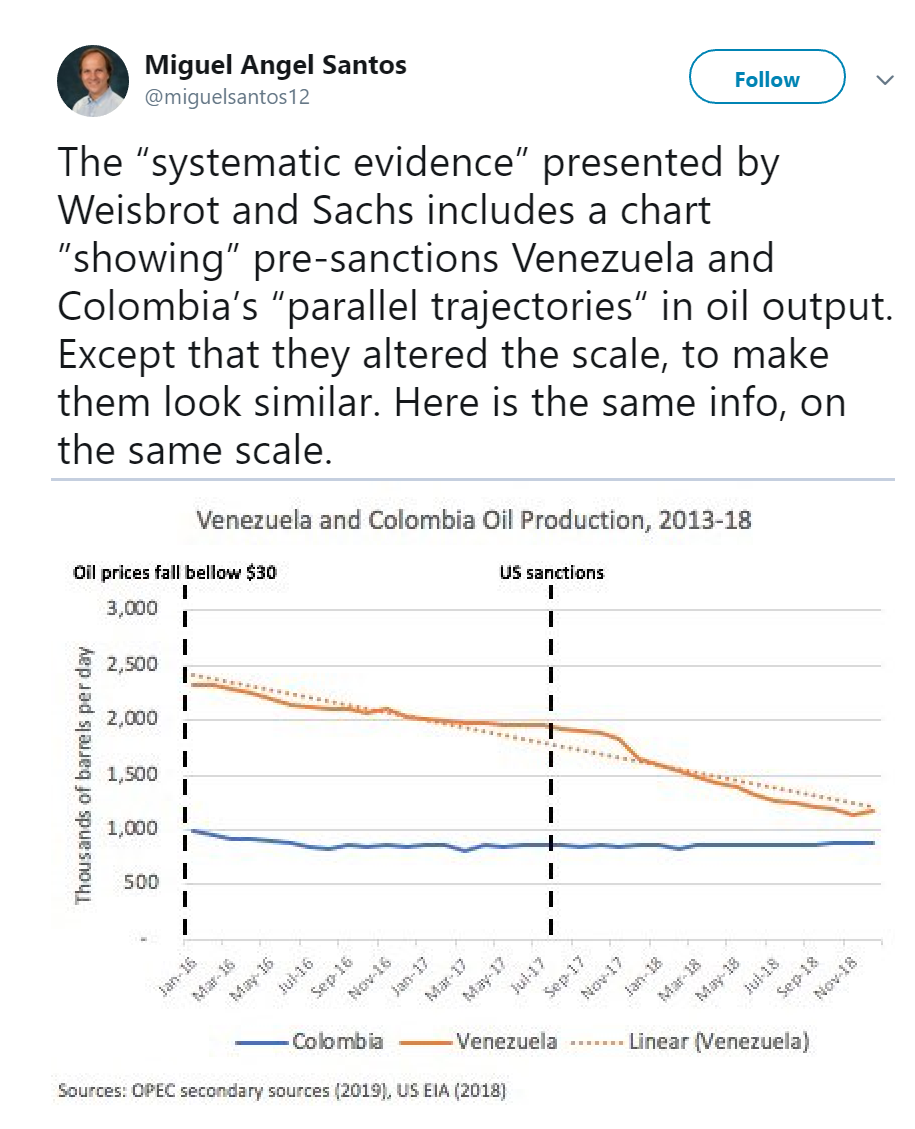
Miguel Angel Santo's response to Figure 1 from Weisbrot and Sachs, with the relevant graph
He writes, on Twitter:
The "systematic evidence" presented by Weisbrot and Sachs includes a chart "showing" pre-sanctions Venezuela and Colombia’s "parallel trajectories" in oil output. Except that they altered the scale, to make them look similar. Here is the same info, on the same scale.
This is deeply ironic. It is Santos who has presented a grossly misleading graph.
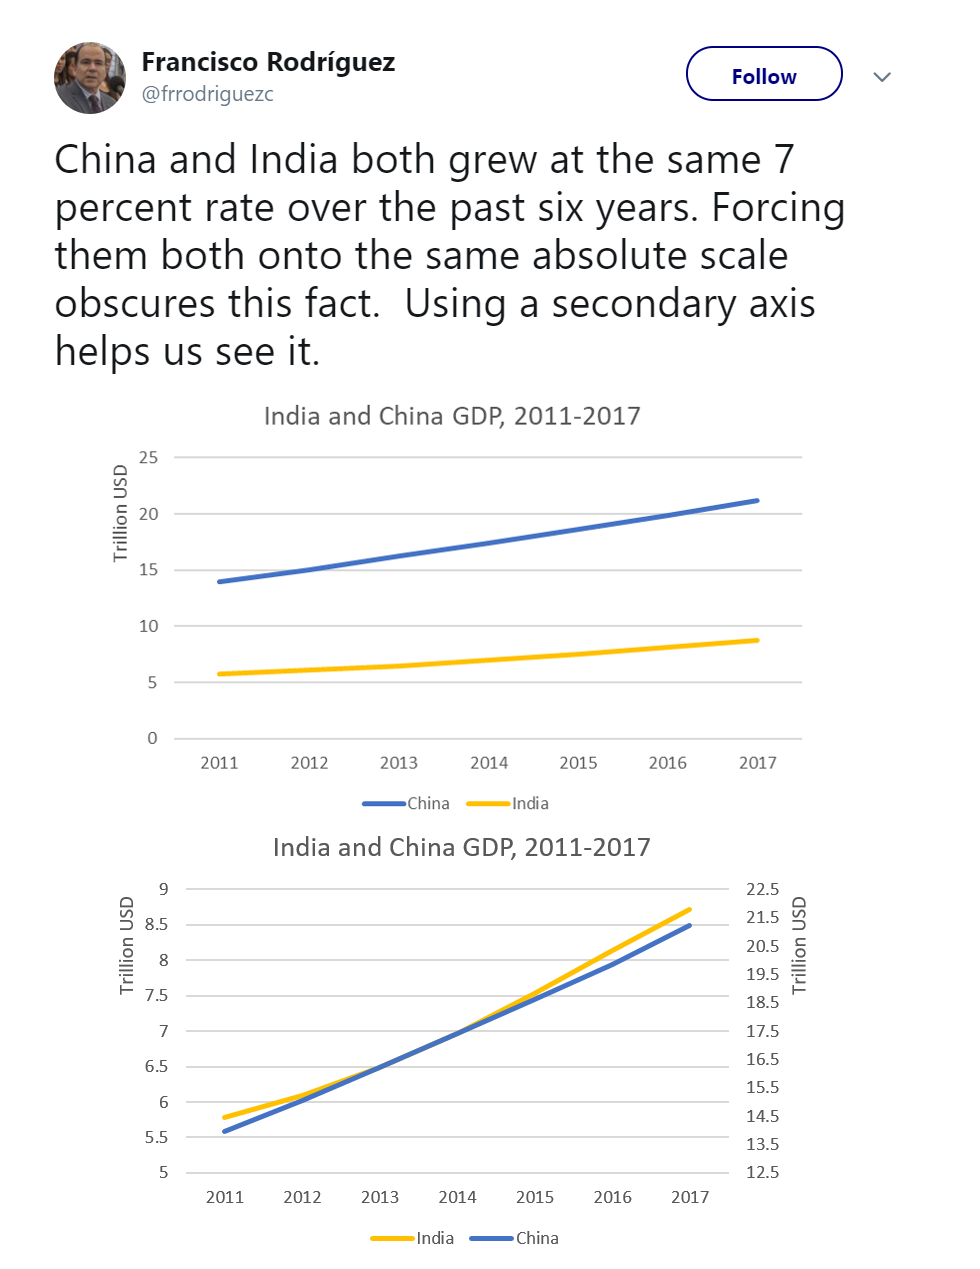
Francisco Rodríguez explains this in a response with the following two graphs:
Francisco Rodríguez's rebuttal to Santos with the relevant graphs
China and India both grew at the same 7 percent rate over the past six years. Forcing them both onto the same absolute scale obscures this fact. Using a secondary axis helps us see it.
As can be seen from the graphs, Rodríguez is correct; the graph that uses different axes for the two time series presents a picture of the two countries’ growth that clearly shows what happened; i.e., in this case, that the two countries grew at about the same rate over this period. This is because China’s GDP is much larger than India’s, so the slope of the graph for China is steeper when they are presented on the same scale.
For the same reason, the graph of oil production with the dual axes (above) presents a much clearer picture of the difference between the rate of decline in oil production than Santos’ graph.
Santos did not respond to this rejoinder from Rodríguez.

Miguel Angel Santo's response to Figure 1 from Weisbrot and Sachs, with the relevant graph
Miguel Angel Santo's response to Figure 1 from Weisbrot and Sachs, with the relevant graph

Francisco Rodríguez's rebuttal to Santos with the relevant graphs
Francisco Rodríguez's rebuttal to Santos with the relevant graphs
The real issue here is the sharp acceleration in the decline of oil production in Venezuela after the August 2017 sanctions; as can be seen below, the rate of decline is three times as fast after the sanctions are imposed as compared to before.
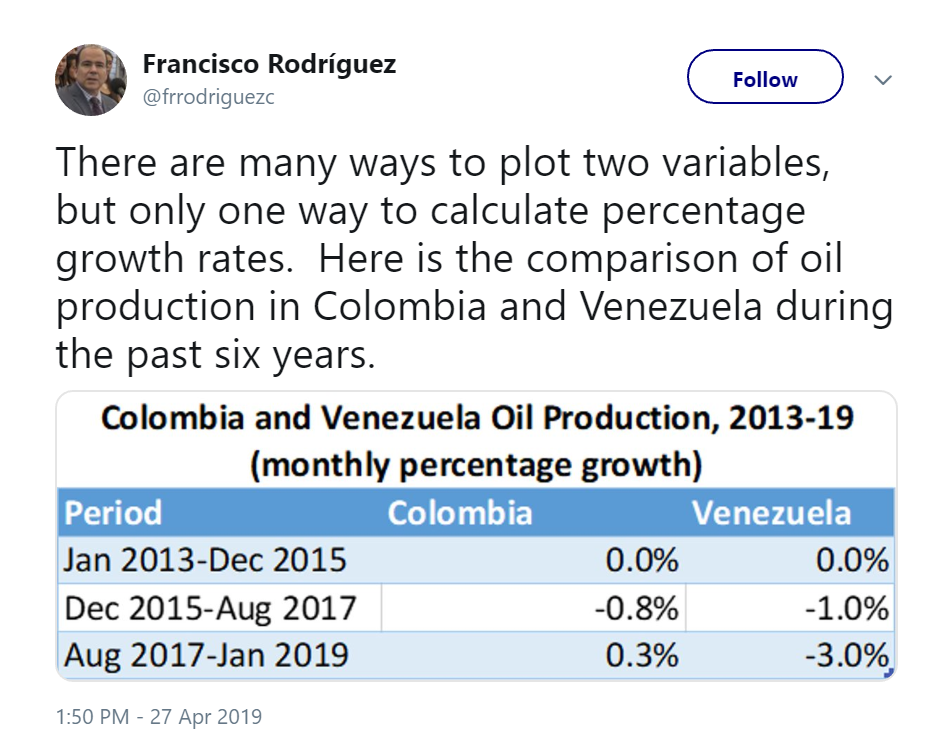
Rodríguez's follow-up tweet
There are many ways to plot two variables, but only one way to calculate percentage growth rates. Here is the comparison of oil production in Colombia and Venezuela during the past six years.
Ricardo Hausmann weighed in with his own comparison, and a graph:
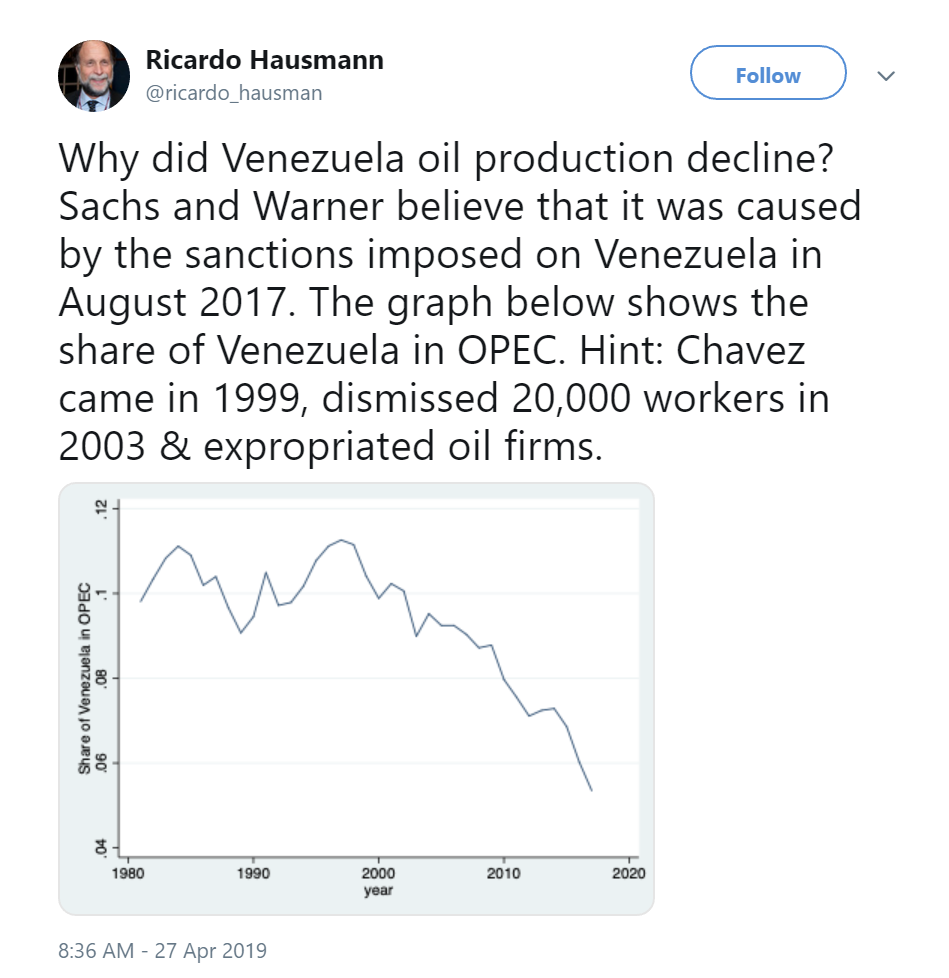
Hausmann's argument about oil production
Why did Venezuela oil production decline? Sachs and Warner believe that it was caused by the sanctions imposed on Venezuela in August 2017. The graph below shows the share of Venezuela in OPEC. Hint: Chavez came in 1999, dismissed 20,000 workers in 2003 & expropriated oil firms.
The problem with this graph is that it is not all that relevant since it does not show Venezuela’s own oil production, but rather its share of OPEC’s oil production, which depends on many factors that influence the production of various OPEC countries. It does not explain why Venezuela’s oil production itself — not as a share of OPEC production — experienced such a sharp acceleration in its decline after the August 2017 sanctions.

Rodríguez's follow-up tweet
Rodríguez's follow-up tweet

Hausmann's argument about oil production
Hausmann's argument about oil production
Interestingly, Santos and Hausmann do not comment on the serious damage caused by the sanctions since January of this year, which was a major part of our paper. As noted above, these have also had an immediate impact and are much more severe. From January to March, Venezuela’s oil production — and therefore the economy’s capacity to import essential goods — fell by 36.4 percent, or 431,000 barrels per day. Rodríguez projects that for 2019 the decline will be more than 67 percent.
In April the IMF changed its October forecast for 2019 of a 5 percent decline in GDP to 25 percent; this also was obviously a result of the January sanctions. It is also obvious to any economist that the humanitarian impact of a 25 percent fall in real GDP is enormous. And today, we learn that estimated imports fell 46.1 percent in one month from January to February.
The consequences are likely to be very severe for the civilian population, indeed potentially catastrophic. We anticipate a further sharp deterioration in the ability of the Venezuelan people to meet their most basic needs, including adequate food, life-saving medicine, safe water, and basic services. The sanctions are putting Venezuelan lives on the line in massive numbers, and risking the lifelong health and development of Venezuela’s children.
Hausmann, like the US Government, has a political agenda: regime change. But he should accept responsibility for an obvious truth. The US-led attempt at regime change, based on strangling the Venezuelan economy, is putting the Venezuelan people’s food supply, medicines, and very lives at grave risk. The Trump Administration is not shy about this, saying repeatedly that “everything is on the table,” including military intervention too, to get their way. The brutal sanctions, rather than a negotiated political solution, holds the entire population hostage to the political aims of the US and to people like our critics. Such sanctions are immoral, in violation of international law, and cruel.
***
If you appreciated this work, please consider a donation to support the Center for Economic and Policy Research.